
Prototype of Power System Event Detection and Early Warning System
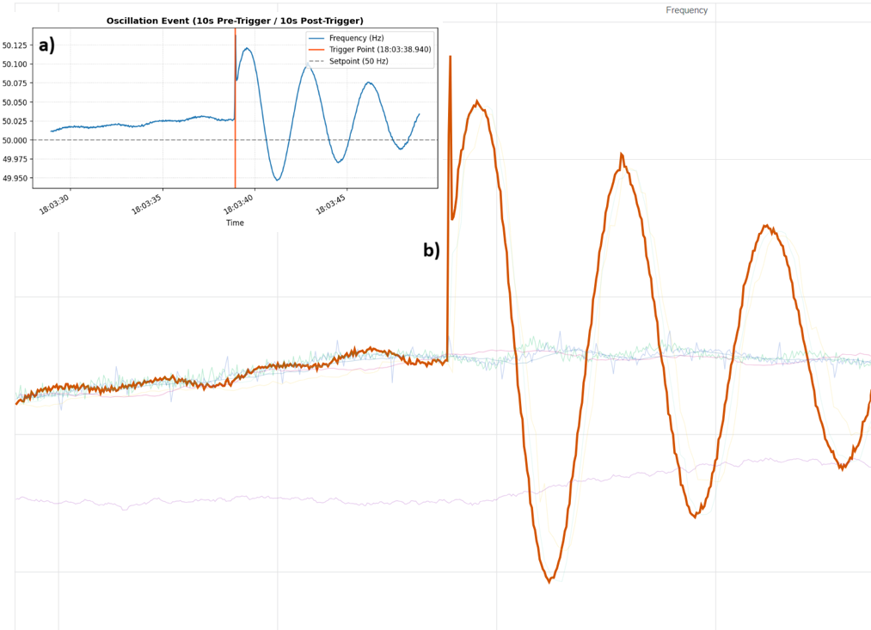
a) 20-second frequency measurement submitted by the tool, including the detection timestamp, versus b) visualisation of the frequency measurement on the SEL SynchroWave platform
Value Proposition
The power system event detection and early warning system is a tool developed jointly by researchers from the National Autonomous University of Mexico (UNAM), the Zurich University of Applied Sciences (ZHAW), and the Institute of Electronics and Computer Science (EDI) in the SPYDER Python IDE. The tool processes frequency measurements that phasor measurement units (PMUs) and/or frequency disturbance recorders (FDRs) pass to the openPDC phasor data concentrator in JSON format. By comparing them against defined criteria thresholds, the tool automatically recognises frequency oscillations and transient processes in the power system and alerts the user about them.
Description of the Tool’s Operation
The tool is based on a “2 out of 4” approach, relying on four analytical criteria related to frequency and its rate of change (RoCoF):
The Fast Fourier Transform (FFT) converts the RoCoF from the time domain into the frequency domain and identifies grid faults by tracking peak spectral magnitude spikes across a short time window.
The Teager-Kaiser Energy Operator (TKEO) calculates the instantaneous energy of the RoCoF signal based on adjacent signal norms to rapidly highlight transient disturbances and sudden bursts.
The Minimum-Maximum range (MinMax) computes the peak-to-peak amplitude range of the RoCoF within a short sliding window to capture the total severity of signal swings.
The Excess Kurtosis (EK) (Normalised Fourth-Order Cumulant) evaluates higher-order statistical moments of frequency variations, detects non-Gaussian anomalies, and sharps distributional changes during system faults.
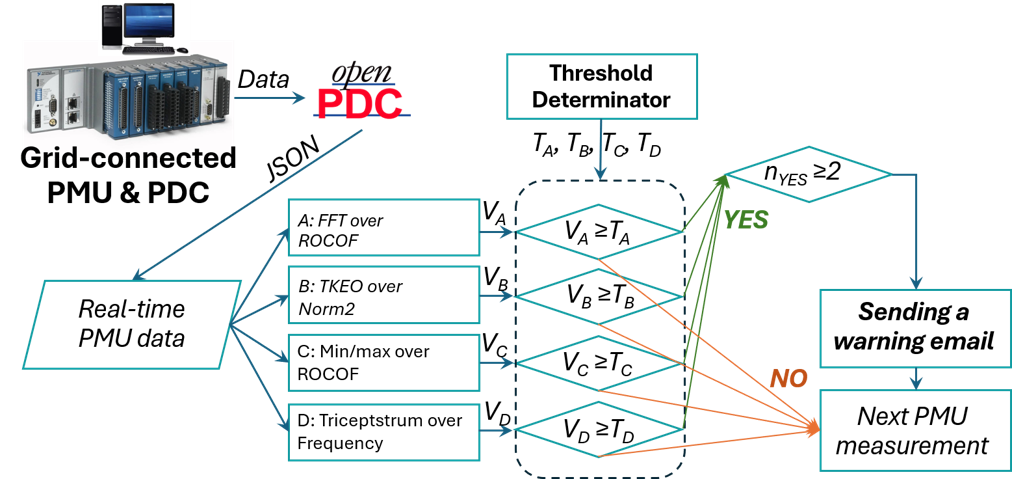
Operation of Power System Event Detection and Early Warning System
Threshold values, also called trigger values, are determined using a data-driven approach. In the offline version of the tool, you can upload frequency measurements of real faults and transient processes, as well as measurement errors recorded by the measuring devices, and the FFT, TKEO, MinMax and EK values are calculated for each of them. To help the tool better distinguish frequency oscillations caused by faults or events from measurement-device error spikes, it includes an additional function for optimising the criteria thresholds. This is a discrete four-dimensional optimisation problem, solved using the exhaustive search (grid search) method. The grid evaluates all possible combinations of the four threshold values, applying the “2 out of 4” detection rule. For each combination, Balanced Accuracy is calculated as the objective function, and the threshold vector that provides the highest balanced accuracy is selected as optimal.
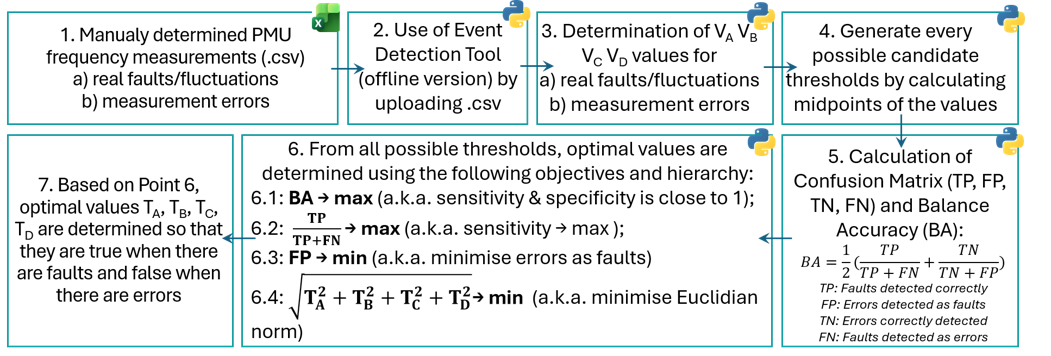
Process for determining threshold values
Cooperation and Potential
In its current version, the tool notifies the user about detected events by sending an email with frequency measurements from 10 seconds before and 10 seconds after the event is detected. The tool can be freely extended and modified, for example, so that a warning signal is generated immediately after the onset of frequency oscillations. The tool automatically informs the user about processes taking place in the power system, thereby speeding up their detection and analysis. This is a significant advantage for both energy researchers and analysts at distribution and transmission system operators. The tool also has great potential for integration into a supervisory control and data acquisition (SCADA) system, which would make it possible not only to record faults but also to detect in good time frequency oscillations that may indicate a risk of cascading and systemic outages.
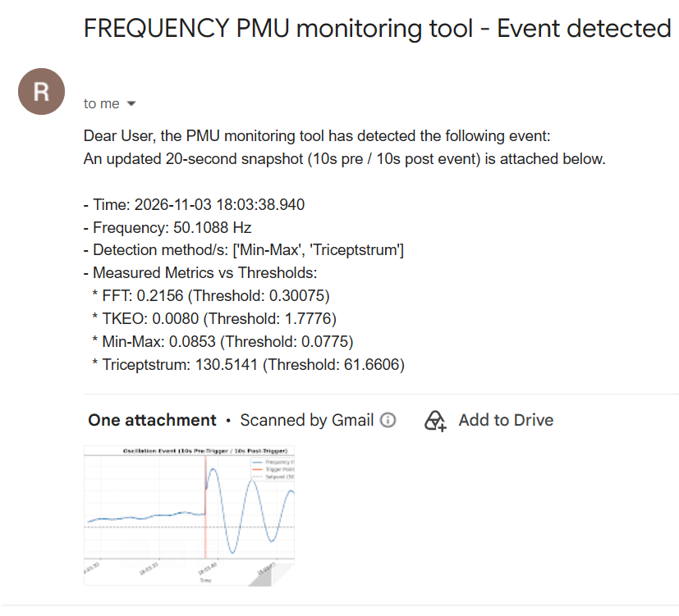 Warning email sent by the tool regarding the detection of a fault
Currently, the tool is at the prototype stage and is being developed further in several directions:
The threshold values appropriate for the Latvian power system are being refined on the basis of more than 100 fault and error measurements.
An add-on is being developed so that several PMUs and FDRs can operate in the tool at the same time.
Machine learning and artificial intelligence functions are being integrated into the tool, which, based on the characteristics of the frequency measurements, would make it possible to determine the type of a possible fault and even its approximate location in the system.