The project’s cooperating institution is the Nature Conservation Agency.
Project aim
To create remote sensing data-based geospatial data layers that would help the Nature Conservation Agency monitor protected marsh habitats. The characteristics and boundaries of marshes vary depending on the task at hand. Most often, bogs border forests, so determining this boundary is particularly important.
As part of the project, the EDI Space Technology Laboratory will create two types of geospatial data for the whole of Latvia:
- A forest distribution layer in accordance with the Forest Law and the Regulations on the Classification of Land Use Types and the Criteria for their Determination.
- A layer of spectral characteristics of bog undergrowth.
These layers will allow specialists to focus their attention on areas where there are discrepancies between the boundaries marked by specialists and those found algorithmically. The information generated by the project will allow the boundaries of bog habitats to be refined and their quality to be assessed.
PurvEO project develops forest map for the whole of Latvia
The aim of the project “Remote sensing and machine learning for monitoring bog habitats” (PurvEO) aims to create remote sensing-based geospatial data layers that would help the Nature Conservation Agency monitor protected bog habitats. The project is funded by the Latvian Environmental Protection Fund and implemented by the Institute of Electronics and Computer Science. The Nature Conservation Agency is the project’s partner institution.
More information about the project is available at: https://www.edi.lv/projects/talizpete-un-masinmacisanas-purvu-biotopu-uzraudzibai-purveo/
We addressed two sub-tasks within the project. In the first sub-task, we used the analysis of LiDAR laser scanning data from the Latvian Geospatial Information Agency to determine the boundaries of forests and bogs in accordance with the criteria set out in the Forest Law and the Regulations on the Classification of Land Use Types and the Criteria for their Determination. The second approach is based on spectral analysis of the ground cover using Sentinel 2 satellite images and an unsupervised machine learning approach. The result is a map of areas across Latvia that are spectrally characteristic of bog habitats.
LiDAR forest boundary map
LiDAR is a remote sensing technology used for mapping three-dimensional (3D) structures. A LiDAR scanner emits laser pulses and measures the time it takes for the pulse to bounce off the object being studied and return to the system. Since the speed of light is known, knowing the return time of the pulse allows the distance from the sensor to the objects being studied to be calculated and information about their 3D structure to be obtained. Laser scanning from an aircraft produces a point cloud that records the coordinates of points on the Earth from which the laser pulses have been reflected.
Point clouds can be used to create derivative data products, the most commonly used of which are digital terrain and surface models. A terrain model shows the 3D structure of the Earth’s surface without objects on it, such as buildings, trees, etc. (see example in Figure 1), while a surface model shows reflections from objects. By subtracting the terrain model from the surface model, we can obtain 3D information only about objects on the Earth’s surface without the influence of terrain, or a normalized digital surface model (see example in Figure 2).
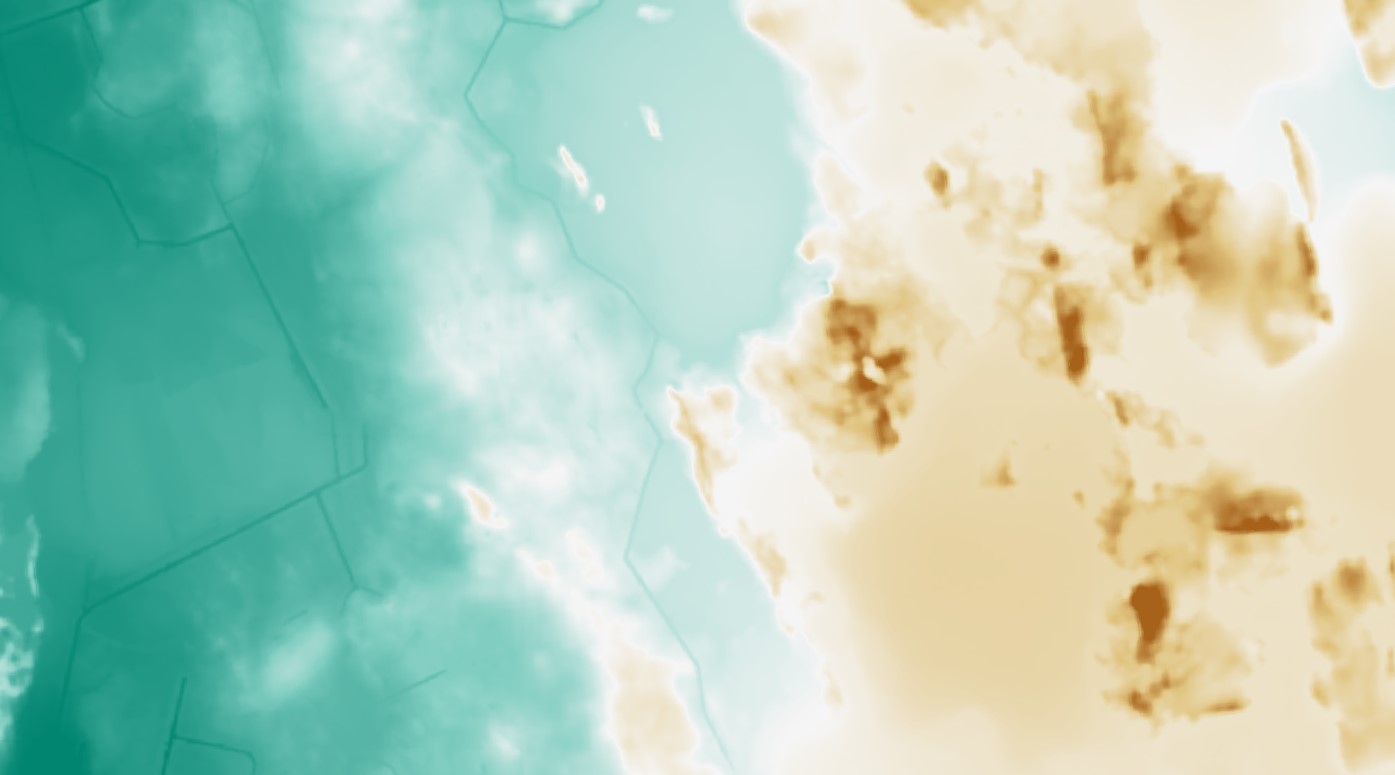 Fig. 1. Digital terrain model. Data: Latvian Geospatial Information Agency (LGIA), processing: EDI.
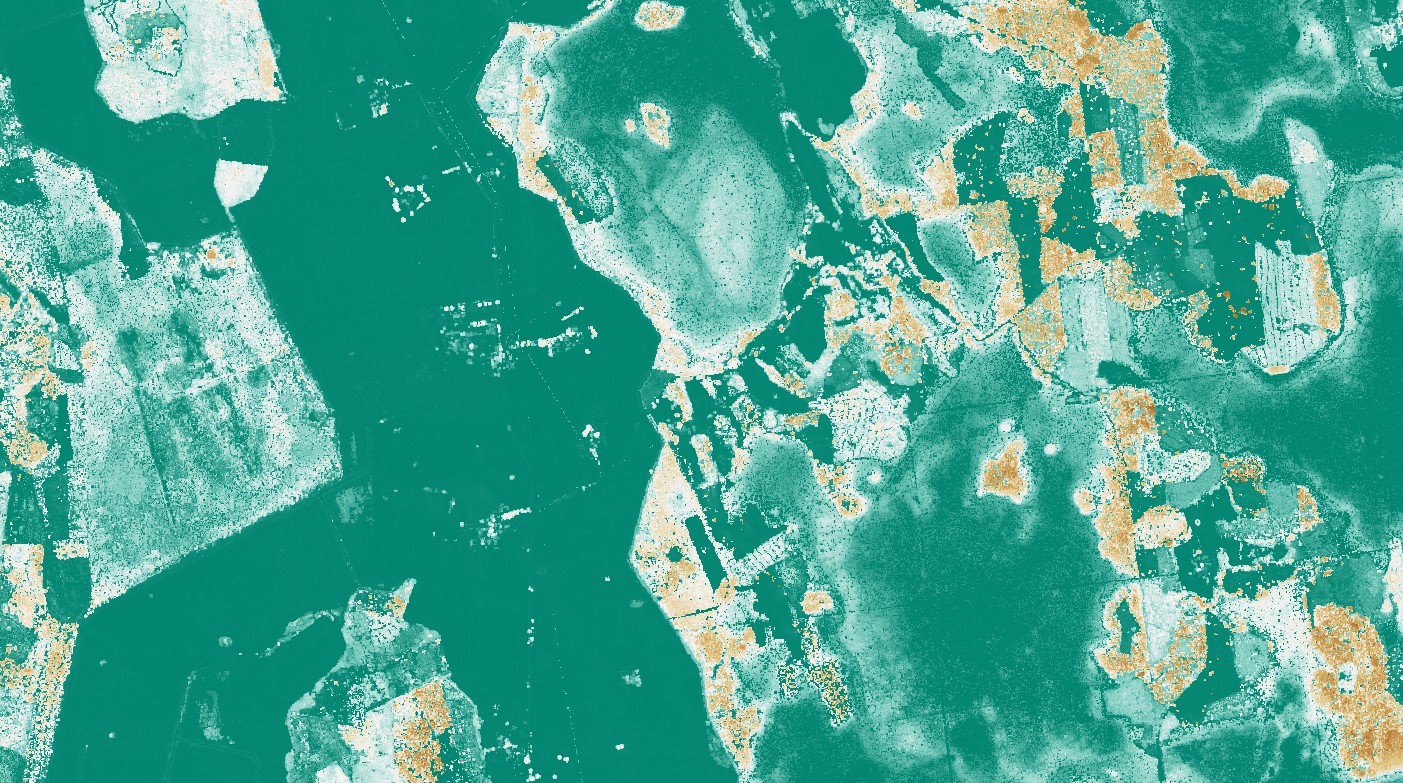 Fig. 2. Normalized digital surface model. Data: LĢIA, processing: EDI.
According to the Forest Law, a forest is “an ecosystem in all stages of development, where the main producer of organic matter is trees, which can reach a height of at least five meters in a given location and whose current or potential crown projection is at least 20 percent of the area occupied by the forest stand.” As part of the activity, research was conducted to determine which of the parameters defining forests specified in the law could be calculated from normalized surface models and included in the computerized data processing workflow.
The resulting workflow analyzes normalized surface models obtained using open LiDAR data from the Latvian Geospatial Information Agency according to six parameters:
- minimum allowable tree height in the forest stand (at least 5 or 7 meters);
- current tree crown projection in a square area (at least 20%);
- size of the square area in which the current tree crown projection is calculated;
- minimum permissible forest stand area;
- minimum permissible stand width;
- maximum permissible clearing area.
These six parameters are variable, and forest maps were calculated for different parameter values. The maps were prepared for the entire territory of Latvia in vector data format (.shp) and can be easily used in any geographic information system. An example is shown in Figure 3.
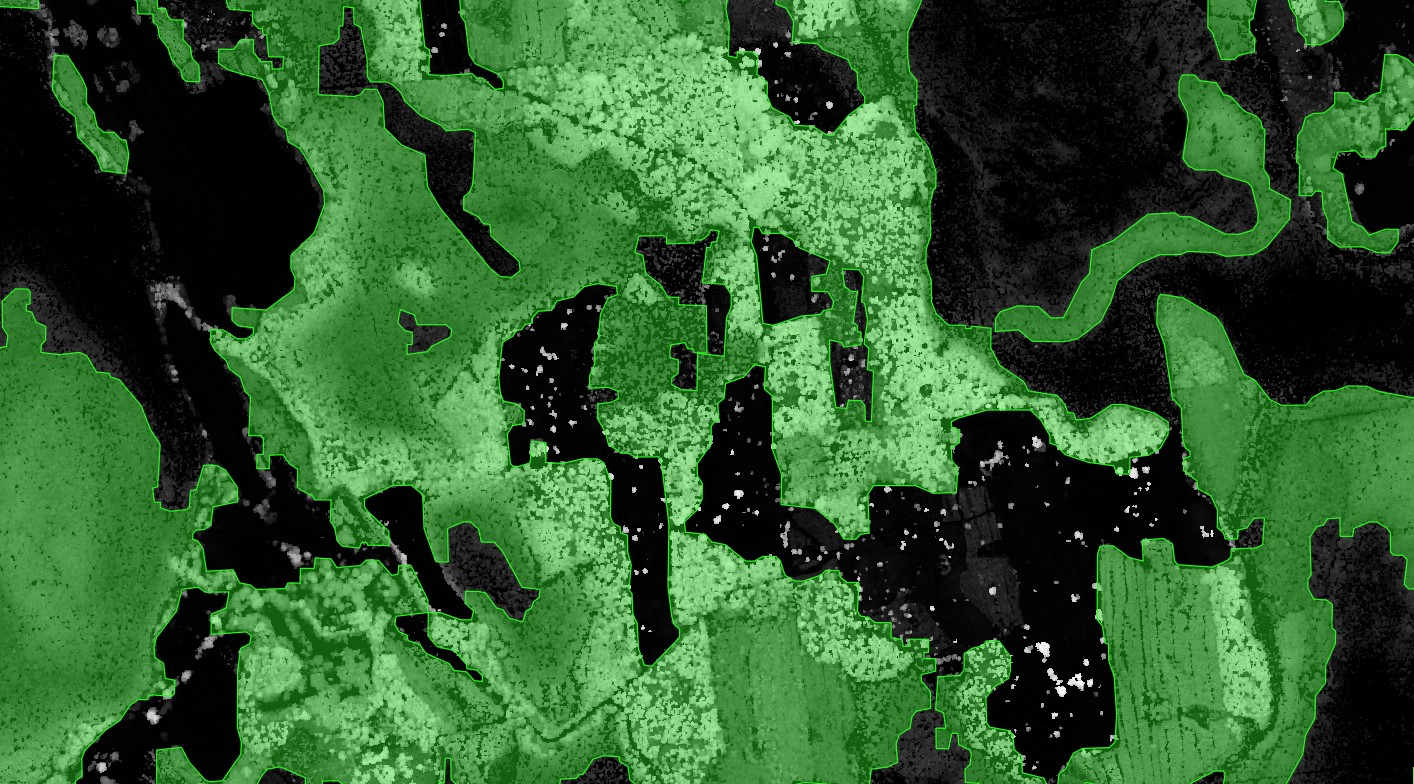 Figure 3. Forest areas found by the workflow are colored green. Parameter values: tree height 7 meters, square area side length 25 meters, minimum allowable forest stand area 0.5 ha, minimum allowable stand width 20 meters, maximum allowable clearing area 0.3 ha.
Map of spectrally similar bog habitats
One of the project activities was to create a robust map of bog vegetation understory segmentation using freely available satellite images from the European Union’s Earth observation program Copernicus Sentinel-2. These satellite images allow the reflection of the undergrowth to be seen in 12 spectral bands, including those outside the human visual range. Sentinel 2 spatial resolution in different spectral bands ranges from 10 to 60 meters per pixel. This resolution is suitable for determining and monitoring land cover types, including various wetland habitats, in medium and large areas.
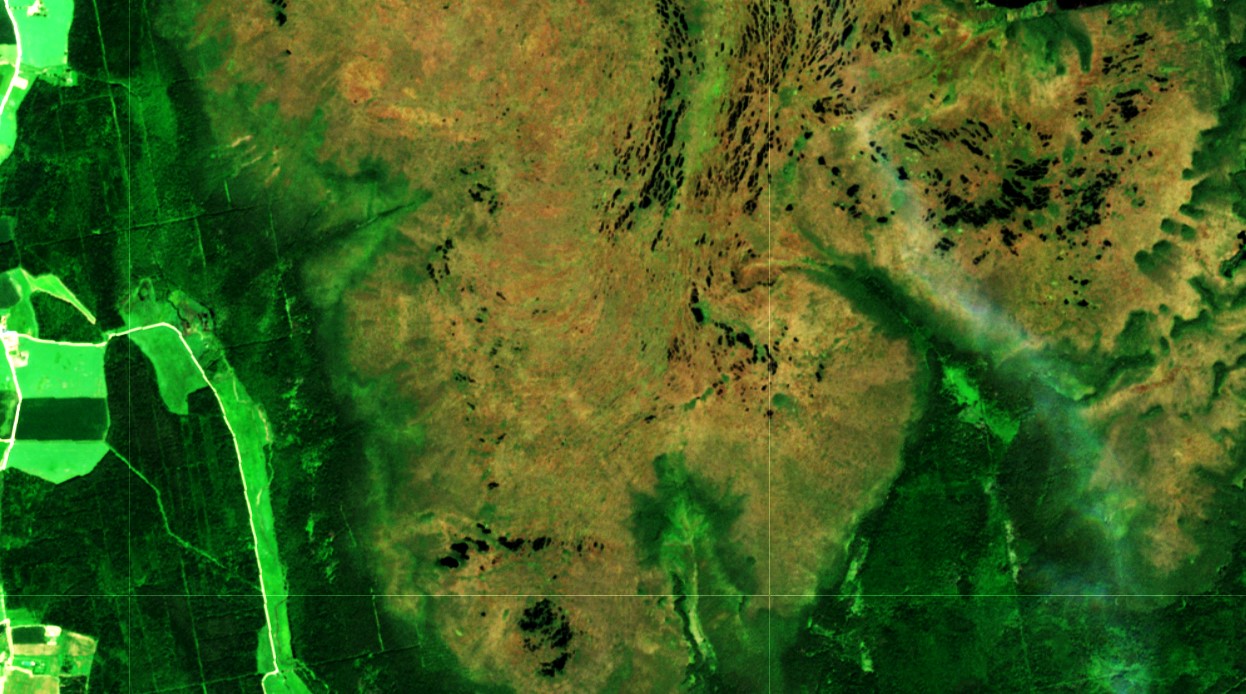
Figure 4. Sentinel-2 satellite image in natural color range.
In the machine learning workflow, we used two seasons (spring and summer) of Sentinel 2 L1C processing level cloud-free image sets. We developed an image selection and processing workflow that allowed us to avoid the impact of the atmosphere (including clouds and their shadows) and changes in the phenological cycle of vegetation on the classification results.
The habitat search workflow is based on semi-supervised classification. There are two main approaches in machine learning: supervised and unsupervised machine learning. Supervised machine learning algorithms require high-quality training data, which is often time-consuming and costly to obtain. Unsupervised classification algorithms, on the other hand, perform clustering, i.e., they search for similar groups of pixels in an image, assuming that visually similar image pixels correspond to specific land cover types, such as certain wetland habitats. Reference/support data is required for the classification of these similar groups of land cover types, but it can be much smaller in volume and not as high in quality as in the case of supervised algorithms. Therefore, we chose an unsupervised machine learning approach for the project.
We used the most recent bog habitat map from the DAP database Ozols as reference data, which already included the results of the recent Nature Counting Project.
As a result of the study, we discovered new areas from Sentinel-2 data in two seasons that are spectrally similar to active raised bogs, degraded raised bogs, and transition mires and fens. We also discovered areas that are classified as bog habitats in DAP data, but are not spectrally suitable.
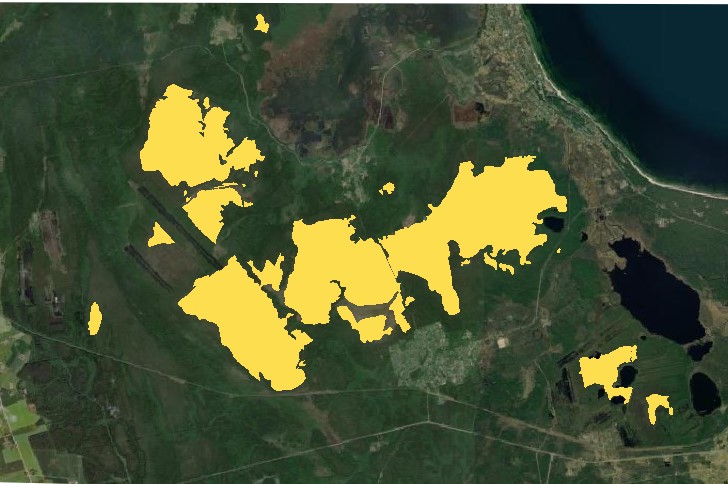
Fig. 5. Raised bog or degraded raised bog area according to DAP data.
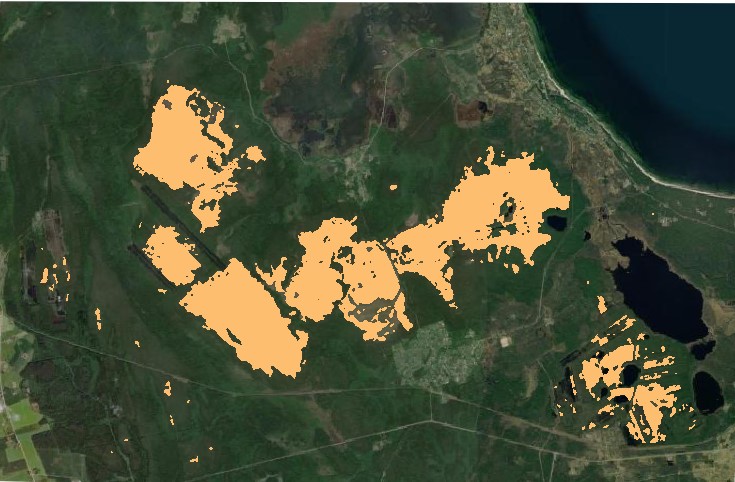
Fig. 6. Map of areas with spectral characteristics similar to those of raised bogs or degraded raised bogs.